Testing the Plot Package
This is a comprehensive testing of your installation to see if LIS/LAS files can be written, read and plotted. The code writes specific LIS/LAS files in memory, reads them back with the appropriate parser then plots them as SVG files.
Running the test
TestPlot is a unit test which also has performance tests within it. It is invoked thus:
$ python tests/unit/test_util/test_plot/TestPlot.py
The response should be something like:
TestClass.py script version "0.1.0", dated 2010-08-02
Author: Paul Ross
Copyright (c) Paul Ross

test_00 (__main__.TestPlotRollStatic)
TestPlotRollStatic.test_00(): Tests setUp() and tearDown(). ... ok
test_01 (__main__.TestPlotRollStatic)
TestPlotRollStatic.test_01(): viewBox. ... ok

... 8<-------- snip, snip, snip -------->8

test_01 (__main__.TestPlotReadLIS_SingleSinCurve) ...  ExecTimerList [6]:
 Loading FrameSet          Size:    0.002 (MB) Time:    0.010 (s) Cost:   3838.393 (ms/MB)
 Initialising LIS plot     Size:    0.000 (MB) Time:    0.001 (s) Cost:        N/A (ms/MB)
 Plotting Tracks           Size:    0.000 (MB) Time:    0.005 (s) Cost:        N/A (ms/MB)
 Plotting XGrid            Size:    0.000 (MB) Time:    0.023 (s) Cost:        N/A (ms/MB)
 Plotting scales (legends) Size:    0.000 (MB) Time:    0.013 (s) Cost:        N/A (ms/MB)
 Plotting curves           Size:    0.002 (MB) Time:    0.141 (s) Cost:   9338.957 (ms/MB)  ok
test_00 (__main__.TestPlotReadLIS_SingleSquareCurveLowFreq)
TestPlotReadLIS_SingleSquareCurve.test_00(): Tests setUp() and tearDown(). ... ok

... 8<-------- snip, snip -------->8

test_12 (__main__.TestPlotReadLAS_XML_LgFormat)
TestPlotReadLAS_XML_LgFormat.test_12(): Plot from XML LgFormat files - density, porosity and multiple gamma ray curves. ...  ExecTimerList [6]:
 Initialising LAS plot: "Porosity_GR_3Track" Size:    0.000 (MB) Time:    0.001 (s) Cost:        N/A (ms/MB)
 Plotting API Header                         Size:    0.000 (MB) Time:    0.016 (s) Cost:        N/A (ms/MB)
 Plotting Tracks                             Size:    0.000 (MB) Time:    0.005 (s) Cost:        N/A (ms/MB)
 Plotting XGrid                              Size:    0.000 (MB) Time:    0.055 (s) Cost:        N/A (ms/MB)
 Plotting scales (legends)                   Size:    0.000 (MB) Time:    0.013 (s) Cost:        N/A (ms/MB)
 Plotting curves                             Size:    0.020 (MB) Time:    0.096 (s) Cost:   5009.433 (ms/MB)  ok

----------------------------------------------------------------------
Ran 107 tests in 34.318s

OK
CPU time =   34.179 (S)
Bye, bye!
The important thing is that there should be no reported failures.
Results
You should find in the directory <TOTALDEPTH>/tests/unit/test_util/test_plot/test_svg a set of test plots.
Index
This directory has an <TOTALDEPTH>/tests/unit/test_util/test_plot/test_svg/index.html that looks like this:
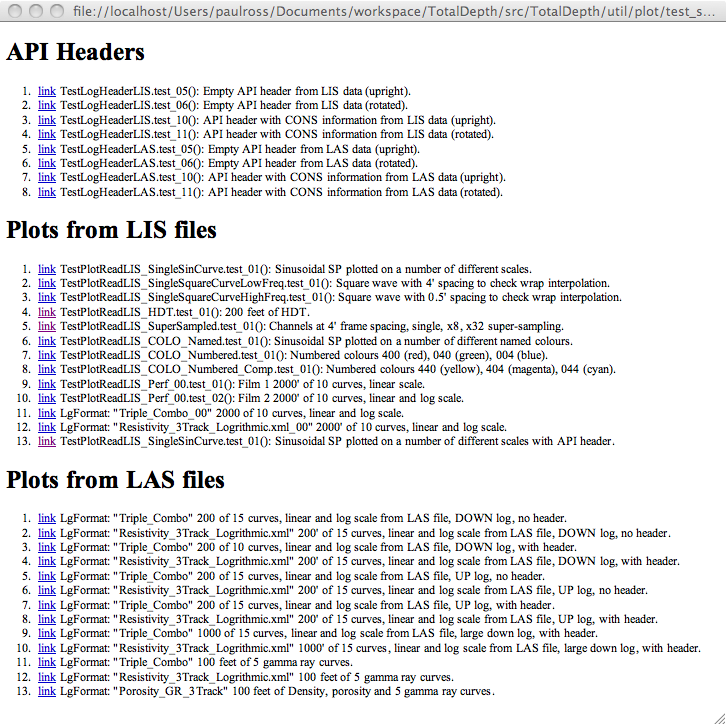
Example Plot
Navigate to a typical test LIS plot from that index such as:
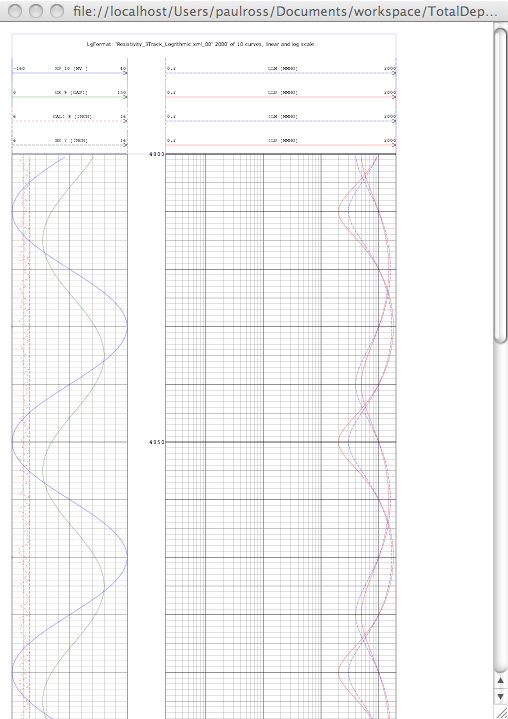
Cool. If you see that then your TotalDepth installation is pretty good!