TotalDepth Example Outputs
This shows some examples of the kind of thing that TotalDepth can do.
Wireline Plots
TotalDepth produced these time honoured plots from LIS and LAS wireline logs in SVG format that can be viewed in most browsers [1].
Plot Examples
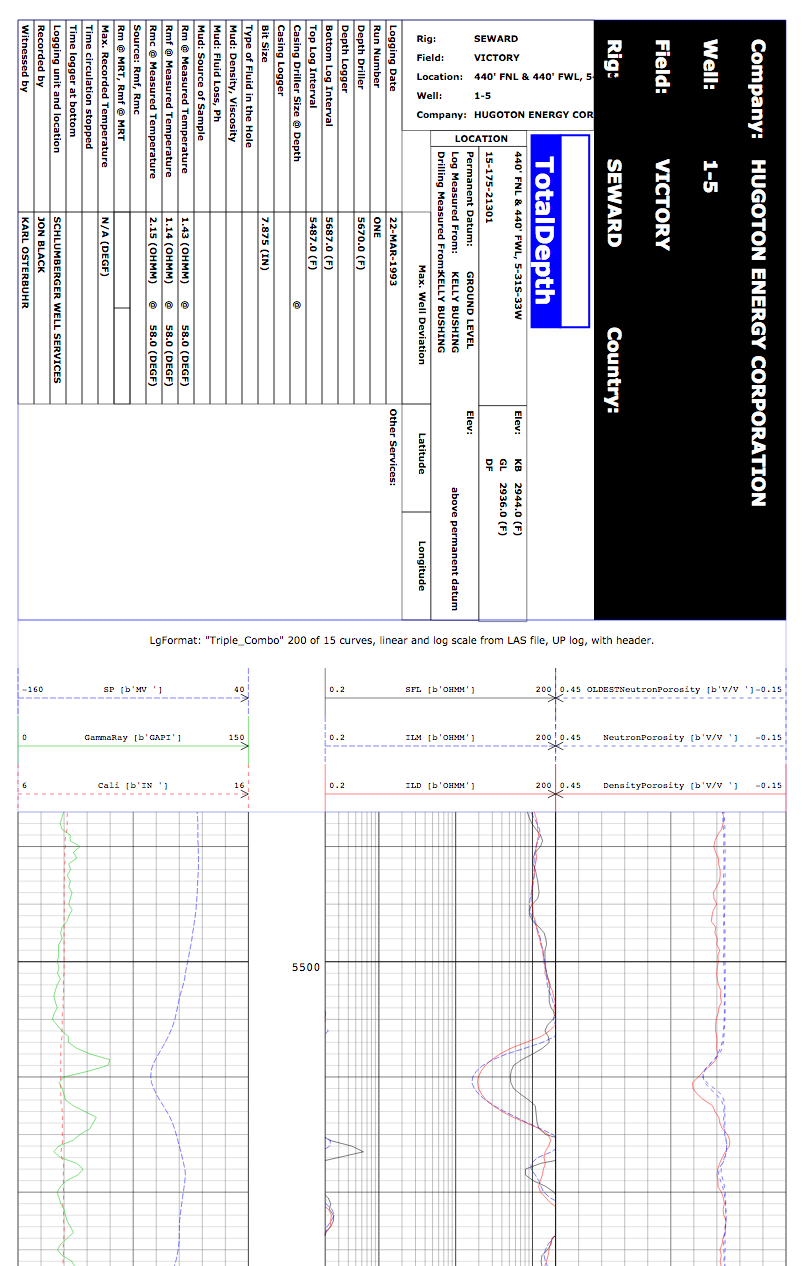
Here is an example of a LAS file plotted with the Triple Combo plot format including the API header:
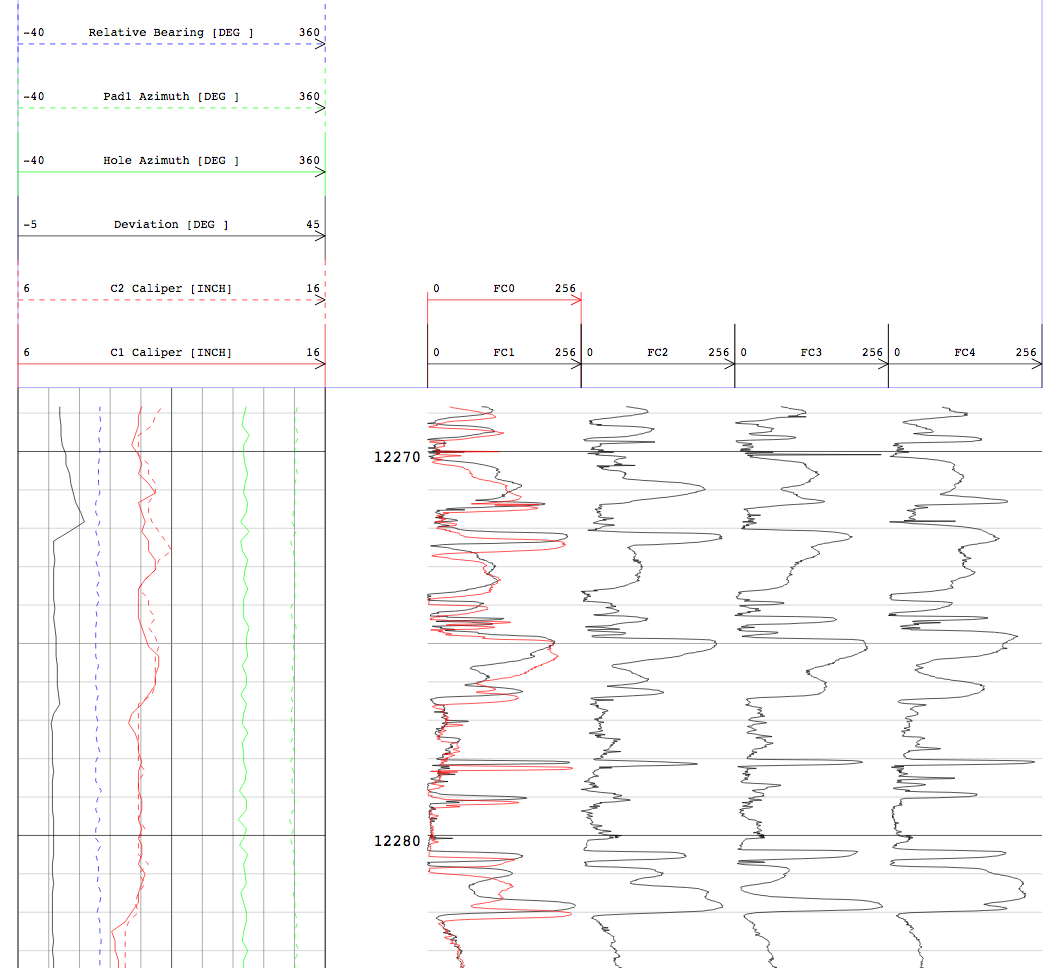
An example of a High Resolution Dipmeter plotted at 1:25 scale:
Plotting from LIS
Some examples of plots generated from LIS79 files:
- A collection of 9 LIS files where TotalDepth used their internal plot specifications to generate 22 separate plots.
- A High Resolution Dipmeter plot on a scale of 1:25 with an API header. Fast channel FC0 (red) overlaid on FC1.
Note
These may not be available in the PDF version of the documentation.
Plotting From LAS
This shows off some examples of plots generated from the Canadian Well Logging Society’s LAS formated files [2].
Single LAS Plot examples
This shows plots of a single LAS file that has 200 feet of 15 curves. TotalDepth can plot this with, linear and log scales and with an API header:
- Plotted with the Resistivity 3Track Logrithmic format.
- The same data plotted with the Triple Combo format.
The original LAS file is here.
Note
These may not be available in the PDF version of the documentation.
A Collection of LAS Plots
Here is a directory of six LAS files that was used to make 31 individual plots complete with an index that summarises them. For each LAS file the plotting program automatically choose from 29 plot formats the formats that produce useful plots [3].
Note
These may not be available in the PDF version of the documentation.
Making LAS Plots
The PlotLogs.py command line tool was used with the command:
$ python3 PlotLogs.py -A -j4 -r -X 4 Data/ Plot/
This searched for LAS files in directory Data/ with the plots being written in directory Plot/.
The following options have been set:
- API headers on the top of each plot:
-A - Multiprocessing on with 4 simultaneous jobs:
-j4 - Recursive search of input directory:
-r - Uses any available plot specifications from LgFormat XML files which result in 4 curves or more being plotted:
-X 4
This took around six seconds to compute. More detail on the PlotLogs.py is here: Plotting Well Logs with tdplotlogs
LIS Log HTML Summaries
The program LisToHtml.py takes LIS file(s) and generates an LIS HTML summary for each one.
How This HTML was Made
The LisToHtml.py command line tool was used with the command:
$ python3 LisToHtml.py -k -j4 -r Data/ HTML/
This searched for LAS files in directory Data/ with the files being written to directory HTML/.
The following options have been set:
- Keep going as far as possible:
-k - Multiprocessing on with 4 simultaneous jobs:
-j4 - Recursive search of input directory:
-r
More detail on the LisToHtml.py is here: Summarise LIS Files in HTML with tdlistohtml
RP66V1 Log HTML Summaries
The program ScanHtml.py takes RP66V1 file(s) and generates an RP66V1 HTML summary for each one.
Note
These may not be available in the PDF version of the documentation.
Footnotes
| [1] | There is good SVG support among current browsers such as Opera, Chrome and Safari. You can find a comparison of browser support for SVG at Wikipedia. |
| [2] | Thanks to the University of Kansas [kgs.ku.edu] for the original data. For these examples that data has been edited or truncated or both. |
| [3] | A useful plot format is one that can handle at least n curves where n is a number that is specified by the user. If the user specifies 4 then there will be at least 4 curves on each plot. |